Government Intervention Increases Prices
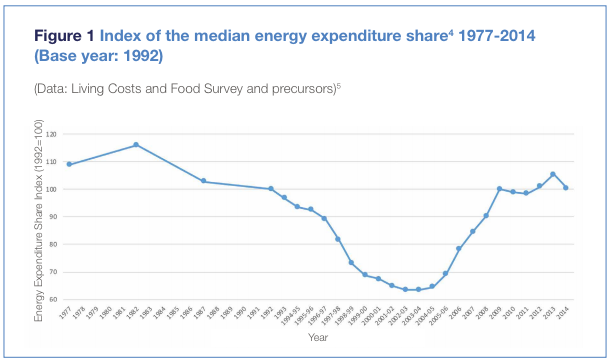
This first chart below shows the power of competition and independent regulation.
British Gas was privatised, and Ofgas created, in 1986 with electricity and OFFER following around three years later. Investment in coal and nuclear electricity generation had previously been very inefficient but it rapidly got much better. But government re-interference in the energy market began around 2003 as oil/gas prices rose and the government (and less than fully independent Ofgem) responded by introducing climate change policies, quotas and capacity payments. This chart shows very clearly what has happened to energy bills.
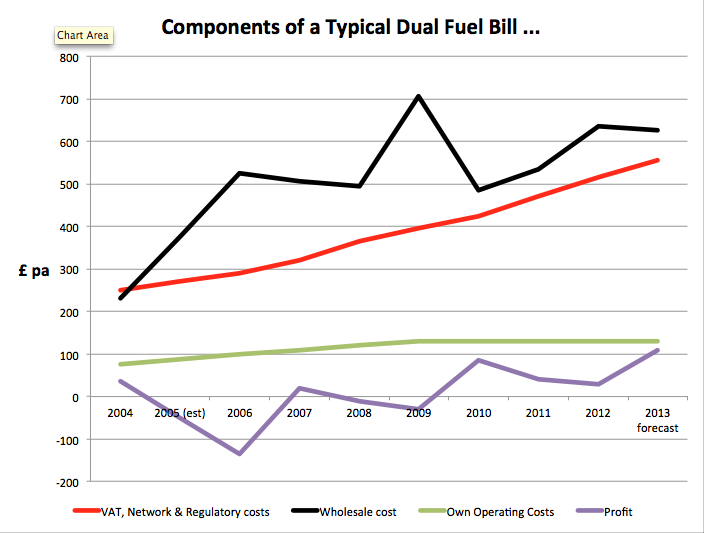
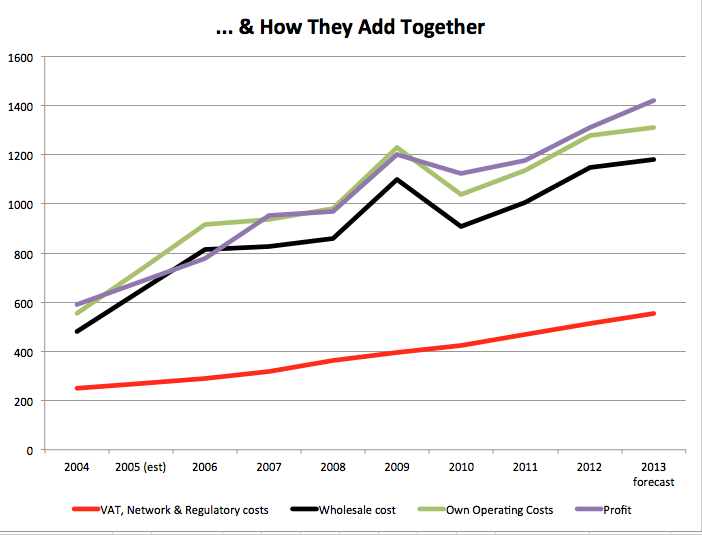
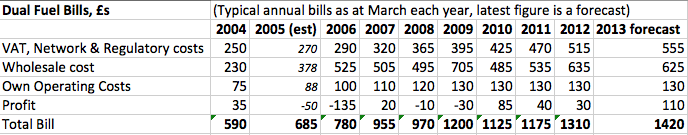
This next charts show in more detail what happened after 2003. Typical annual combined gas and electricity bills increased from around £590 in 2004 to £1420 in 2013. The first chart shows trends in the size of the main components of the cost of providing energy to the home. The steepest increase was in government-imposed costs - the red line.
The second chart includes the same data but shows how they added together to create the total cost.
These two charts show that a very large part of the pre-2013 increase in domestic fuel bills was due to government/regulator imposed costs (the red line in the charts) including investment in new transmission capacity, the £2 billion pa Renewables Obligation and the 2.2% Non-Fossil Fuel Obligation. Energy company profits (the purple line) have also risen and are now typically around £100 pa per household. Wholesale oil/gas prices (the black line) rose sharply from 2004 to 2006 but have risen by only around £100 pa since then. Note, however, that part of this increase is likely due to the policy decision to switch away from cheap coal generation to more expensive gas-fired power stations.
 The figures underlying the above charts are in Note 1 below.
Ofgem subsequently published a further chart containing similar data from 2009 to 2014. You can find it on this web-page.
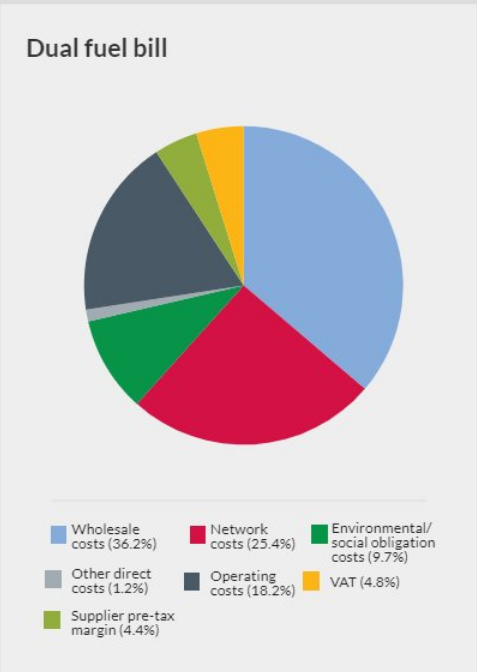
The Ofgem pie chart on the left shows the components of a typical annual dual fuel bill in 2017. Note again how the suppliers' profits (4.4%) and costs (19.4%) are dwarfed by costs outside their control, including costs specifically imposed by government - environmental obligations (9.7%) and VAT (4.8%). The total bill was £540 for gas and £577 for electricity - totalling £1,117.
2018 Price Cap
Government meddling, or consumer protection (depending on your point of view) reared its head again 2017 when Prime Minister Theresa May announced at her party conference that she would after all introduce a temporary cap on single variable tariffs. The detail, and subsequent developments, are in the detailed history pages of the Energy section of this website.
Increased Regulatory Complexity
Successive governments' desperation to react to public concern about energy prices, climate change, fuel poverty and energy generating capacity led to them regularly heaping additional duties on Ofgem. The following chart has been prepared by the Centre for Competition Policy at the University of East Anglia (CCP) and brilliantly shows how a tottering edifice of Principal Objectives, Primary Duties, Secondary Duties and Tertiary Duties has been built up over the years following the Gas Act 1986 - and Ofgem has another quite separate set of objectives etc. for its regulation of the electricity industry. (Click on the chart to view it as a large scale poster.)

CCP and the UKERC published a fascinating report - Fairness in Retail Energy Markets - towards the end of 2018. This blog summarises its conclusions insofar as they relate to Energy Regulation and Government Interference.
Notes
Note 1 - The figures underlying the above charts are summarised in this note:
Note 2 - The NAO reported in 2016 that subsidies for green electricity would add £110 to the average household energy bill by 2020.
Note 3 - For more detail, I recommend Catherine Waddams' 2018 history and analysis of energy price controls and the 2018 report Fairness in Retail Energy Markets.